
If you trade perpetual futures, you’ve felt the subtle push and pull of funding. Getting funding right can be the difference between catching a trend with conviction or fading a crowded move. This guide breaks down how to analyze funding rates on Bybit, how to read their signals in context, and how to fold them into your trading process without overfitting or second-guessing.
- 20% trading fee discount
- $100 signup bonus
- $10,000 futures bonus
- 20% trading fee discount
- $30,050 signup bonus
- 20% fee cashback
- $10,000 bonus
- 20% fee cashback
- $60,000 futures bonus
- 50% trading fee discount
- 20% fee cashback
- $6,200 futures bonus
- Bonus pack worth $100–$1,500 USDT
- Fee discount
- 20% fee cashback
- $8,000 bonus
Before we dive in, a quick win: new users can get a 20% fee discount and up to $30,050 in benefits when they join Bybit using this special link and code: Join Bybit with code CRYPTONEWER. Apply code CRYPTONEWER at signup to lock in the discount.
Why funding rates matter on Bybit
Perpetual futures don’t expire, so exchanges use funding to tether the perp price to the underlying spot index. Every funding interval, one side of the market pays the other:
- Positive funding rate: longs pay shorts.
- Negative funding rate: shorts pay longs.
On Bybit, funding typically settles every 8 hours (00:00, 08:00, 16:00 UTC). The funding fee you pay or receive is:
- Funding Fee = Position Value × Funding Rate at the funding timestamp
What funding really signals:
- Sentiment skew: Persistent positive funding suggests traders are paying a premium to be long; persistent negative funding suggests a premium for shorts.
- Crowding/imbalance: Extreme funding often indicates crowded positioning and can precede mean-reversion or sudden liquidations.
- Regime shifts: Funding diverging from price (e.g., price up while funding falls) can reveal hedging pressure or cautious leverage.
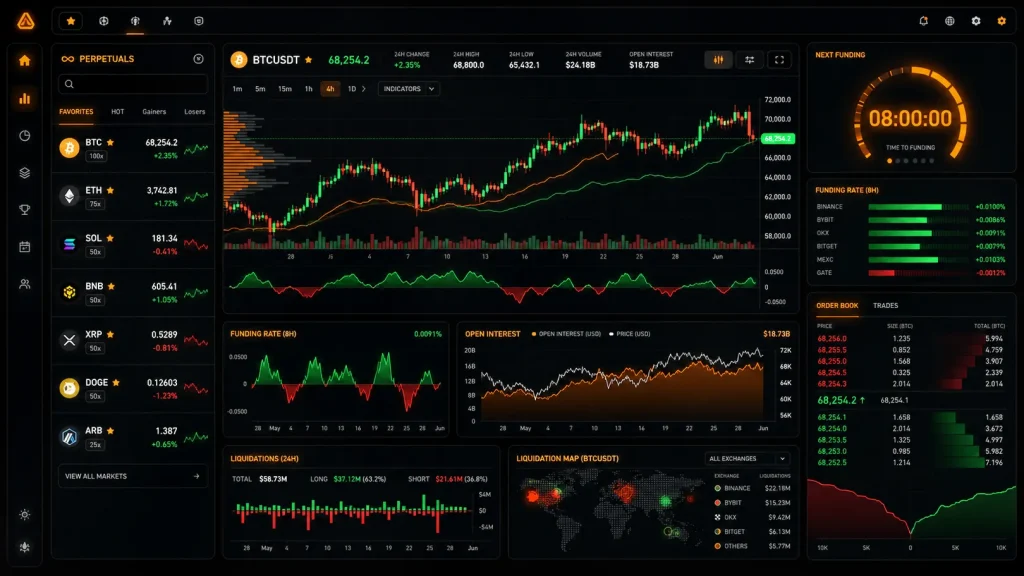
Where to see funding on Bybit
You can view funding rates for each perpetual contract directly on the Bybit trading interface:
- Open the derivatives contract (e.g., BTCUSDT Perpetual).
- Locate the “Funding Rate” and the countdown timer on the contract panel.
- Toggle to view the next funding and the estimated rate for the upcoming interval.
- Use the data/analytics section in your account or Bybit’s market data pages to review historical funding trends per symbol.
For hands-on trading, pin a few symbols to your watchlist and track:
- Current funding rate and the next estimate
- Time until the next funding payment
- Recent history (past few days) to understand persistence and regime
Pro tip: If you automate alerts, trigger them when estimated funding pushes above a threshold (e.g., +0.05%) or below (e.g., −0.05%) and when those levels persist across multiple intervals.
A practical framework to analyze Bybit funding rates
Think in layers: Level, Trend, Context, and Timing.
1) Level
– Is the funding mildly positive/negative, or is it extreme?
– Mild positives or negatives often reflect healthy directional interest. Extremes can mean crowding and a higher risk of squeezes.
2) Trend (persistence)
– One spiky reading is noise; multiple intervals at elevated positive or negative funding show persistence.
– Track moving averages of funding (e.g., 3-interval or 9-interval averages) to see if pressure is building.
3) Context
– Pair funding with open interest (OI):
– Rising OI + rising positive funding = increasingly crowded longs.
– Rising OI + falling/negative funding = increasingly crowded shorts.
– Pair with price:
– Price up + rising positive funding = trend with euphoric leverage (vulnerable to squeezes down).
– Price up + flat/negative funding = stealth uptrend (hedged/institutional flows), often stronger.
– Price down + rising negative funding = fear-driven short pile-on (vulnerable to sharp bounces).
– Price down + flat/positive funding = longs refusing to give up (rally attempts likely to be sold).
4) Timing
– Funding settles every 8 hours. Moves near the settlement can be choppy as traders adjust positions to avoid paying.
– Intraday: Expect funding-driven mean reversion close to the funding timestamp if levels are extreme.
– Swing: Look for multi-day persistence and divergence with price and OI to frame bigger moves.
Interpreting common funding scenarios
- Strong uptrend, positive but moderate funding: Healthy. Favor trend-continuation setups, but monitor OI for overheating.
- Strong uptrend, extreme positive funding that persists: Crowd longs in control, liquidation risk grows. Watch for failed breakouts and momentum stalling; consider reducing leverage or hedging.
- Range-bound market, oscillating funding around zero: Mean-reversion setups work better; funding is less informative alone.
- Sharp selloff with deeply negative funding: Shorts get paid, but if OI spikes and funding stays very negative for multiple intervals, a violent short squeeze becomes more likely.
Turning funding data into trade ideas
- Fade extremes around settlement: If funding is unusually high/low into the funding timestamp, look for quick mean-reversion trades, especially on overextended intraday moves.
- Follow-the-flow with risk controls: When funding starts mildly positive and strengthens over days while price stair-steps higher and OI builds, trade with the trend but scale in and trail risk.
- Hunt divergences: If price makes new highs but funding cools (or turns negative), that’s a stealth bid. Conversely, price grinding down while funding rises is a warning that dip buyers are stuck.
- Cross-asset confirmation: Funding skew across BTC, ETH, and high-beta alts can hint at rotation. If majors cool but alts show extreme positive funding, rotation risk and rug-pull squeezes increase.
Funding plus other key metrics
- Open Interest (OI): Magnifies the meaning of funding. Moves with funding show commitment; spikes against funding show hedging.
- Long/Short Ratios: Crowd positioning confirmation. Extreme long ratios plus high positive funding strengthen a fade setup.
- Liquidation Heatmaps: If high funding aligns with nearby liquidation clusters above or below price, expect volatility as those zones are tested.
- Spot-premium vs. perp: If the perpetual trades rich to spot while funding is positive and rising, the premium can compress via a pullback or funding normalization.
Build a repeatable workflow
Daily routine (10–15 minutes):
- Scan top symbols: BTC, ETH, your two favorite alts.
- Note current funding, next estimate, and changes from yesterday.
- Check OI and price structure (trend, range, key levels).
- Set alerts for funding thresholds and for price near liquidation clusters.
- Journal observations to learn which patterns fit your style.
Weekly routine:
- Review historical funding to spot persistent skews.
- Evaluate how funding interacted with major catalysts (FOMC, ETF flows, token unlocks, CPI prints).
- Update playbooks: Which spreads or pairs reacted strongest to funding extremes?
How to access historical funding data programmatically
Bybit offers a public API that includes recent funding history for perpetual contracts. Example with Python and requests (replace the symbol to your needs):
“`python
import requests
Example endpoint for Bybit V5 market funding history (public)
Docs may evolve; check Bybit’s latest API reference for updates.
url = “https://api.bybit.com/v5/market/funding/history”
params = {
“category”: “linear”, # linear for USDT-margined perps; use ‘inverse’ for coin-margined
“symbol”: “BTCUSDT”,
“limit”: 200
}
r = requests.get(url, params=params, timeout=10)
r.raiseforstatus
data = r.json
Each entry typically includes fundingRate and fundingRateTimestamp
for row in data.get(“result”, {}).get(“list”, []):
print(row[“fundingRate”], row[“fundingRateTimestamp”])
“`
What to compute:
- Moving averages of funding (3/9 intervals)
- Z-scores of funding vs. its 30-day distribution
- Funding rate-of-change into settlement windows
- Correlations with OI and price returns around funding timestamps
Risk management when trading funding signals
- Position sizing: Treat funding edges as contextual, not standalone signals. Size small unless multiple signals agree.
- Leverage discipline: Funding extremes coincide with liquidation clusters. Low leverage keeps you in the game when volatility spikes.
- Time decay of signals: A single extreme print is weaker than multi-interval persistence. Avoid chasing one-off spikes.
- News sensitivity: Macro data or protocol headlines can overwhelm funding-driven setups.
Practical tips for Bybit funding analysis
- Track the estimate: The estimated next funding rate often tells you how traders are positioned right now.
- Compare across pairs: If BTC funding cools while alt funding climbs, risk may be rotating. Adjust exposure accordingly.
- Watch funding just after settlement: Abrupt flips can happen as traders rebalance to avoid paying the fee.
- Separate day trading vs. swing: Intraday scalps may fade extremes near settlement; swing traders look for persistent skews over multiple days.
Common mistakes to avoid
- Treating funding as a standalone buy/sell signal. It’s a lens, not a trigger.
- Ignoring OI. Funding without OI context can mislead.
- Overfitting thresholds. What’s “extreme” shifts by market regime and asset.
- Forgetting the clock. Many flips happen within minutes of funding settlement.
Quick-start checklist
- Add BTCUSDT and ETHUSDT perps to your Bybit watchlist.
- Note current funding and the countdown timer.
- Set alerts for funding beyond ±0.05% (adjust per market conditions).
- Cross-check OI and liquidation levels before executing.
- Journal one insight per day from funding and price action.
FAQ: How to Analyze Funding Rates on Bybit
- What time is funding on Bybit? Every 8 hours (commonly 00:00, 08:00, 16:00 UTC). Check the on-screen timer for exact settlement.
- Who pays whom? Positive funding: longs pay shorts. Negative funding: shorts pay longs.
- Does high positive funding mean short immediately? Not necessarily. Combine with OI, price structure, and liquidation maps. High positive funding in a fresh breakout can keep grinding higher before it reverses.
- How do I automate alerts? Use the Bybit API to poll estimated funding and push alerts via your preferred stack (Telegram, Slack, email) when thresholds hit.
Get a head start on fees and perks
If you’re opening a Bybit account or spinning up a fresh sub-account, this is the easiest edge you can capture today: Join Bybit with code CRYPTONEWER to secure a 20% fee discount and up to $30,050 in benefits. Lower fees improve strategy expectancy, especially for funding-driven scalps and frequent hedging.
Mini glossary
- Perpetual future (perp): A futures contract without expiry.
- Funding rate: A periodic fee exchanged between longs and shorts to keep the perp close to spot.
- Open interest (OI): Total number of outstanding contracts; a proxy for position size and leverage in the system.
- Liquidation: Forced closure of a leveraged position when margin is insufficient.
Educational only. Not financial advice. Trading crypto derivatives carries significant risk; manage leverage and always use robust risk controls.
Related posts:
 How Blockchain Enables Micropayments with an Essential Playbook for Pay‑Per‑Use and Streaming Money
 Proven Insights: How Blockchain Enables Peer-to-Peer Transactions at Internet Speed
 Binance listed coins 2026: Insider breakdown of new listings, exact dates, and smarter ways to trade them
 Proven Steps — How to Set Stop-Loss and Take-Profit on Binance