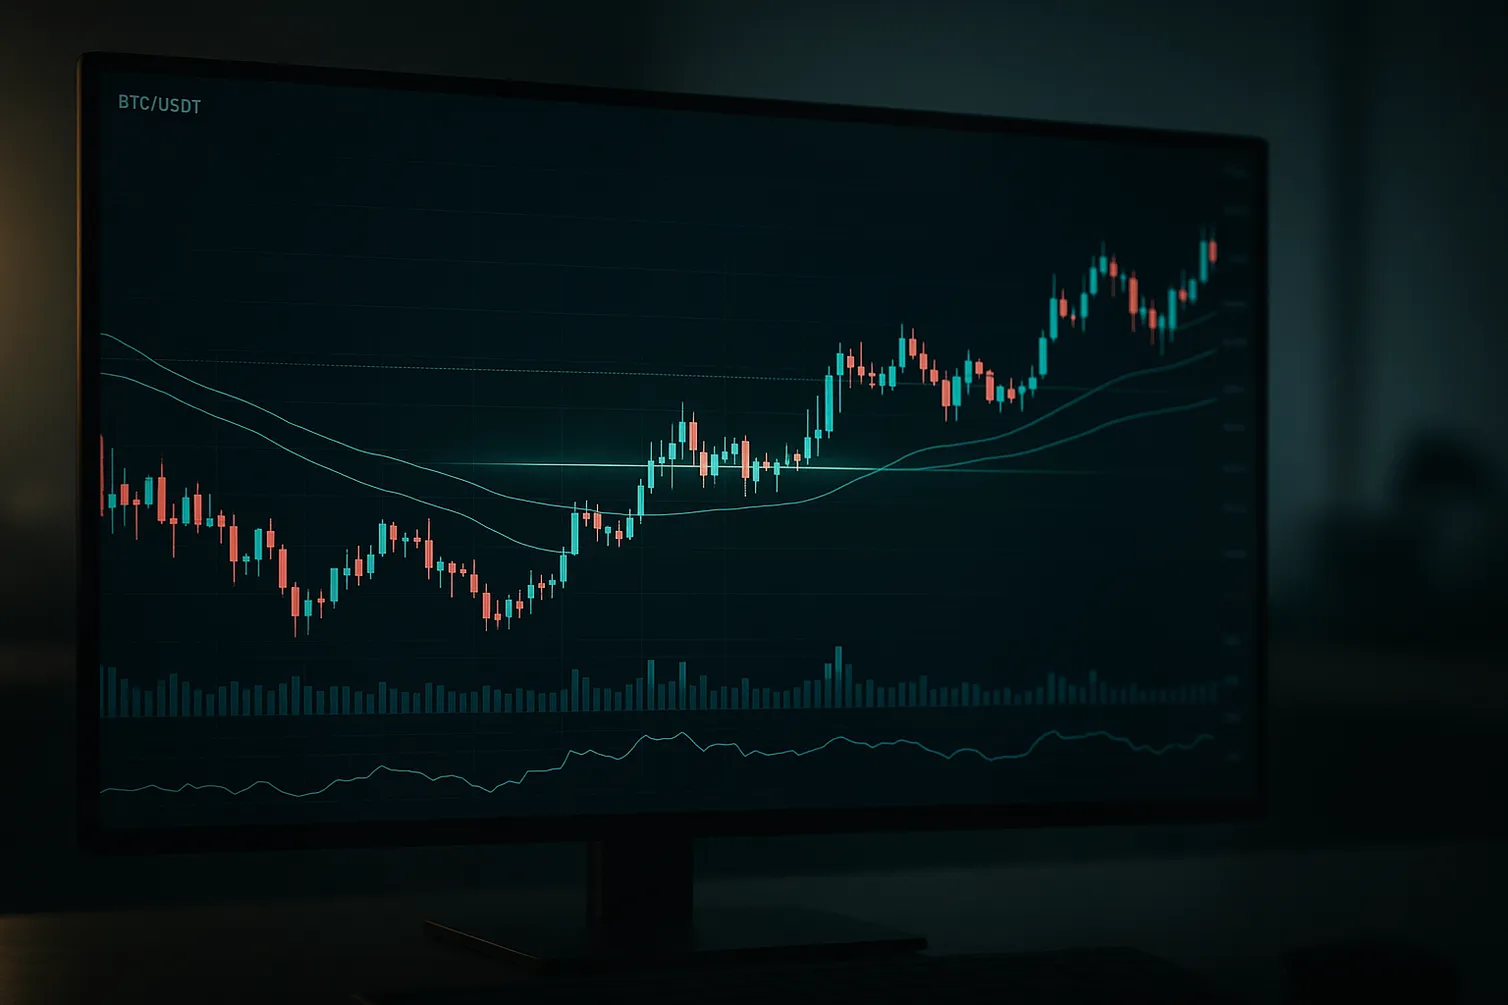
If you want consistent crypto trades, you need a clear charting process. This guide shows you exactly how to read, set up, and act on price action on MEXC with confidence.
Join MEXC with code mexc-CRYPTONEWER to follow along with live charts, layouts, and indicators. Referral code: mexc-CRYPTONEWER
Why learning How to Analyze Charts on MEXC changes your trading
- You turn noise into structure by mapping trend, momentum, and liquidity.
- You build repeatable entries and exits instead of guessing.
- You avoid FOMO by letting price confirm your plan.
This is a practical, field-tested workflow for MEXC chart analysis. It works for beginners and for traders refining their edge. You’ll learn short-tail and long-tail techniques: from basic candlesticks to combining EMA + RSI + Volume, from breakout confirmation to managing risk with stop placement.
Quick start checklist for MEXC charts
1) Open a chart on MEXC
– Choose a pair with good liquidity (e.g., BTC/USDT, ETH/USDT, or strong altcoins with volume).
– Set your base timeframe: 1D or 4H for swing, 1H or 15m for day trading, 1–5m for scalping.
2) Set your visual basics
– Candlestick type: standard candles.
– Add key moving averages: EMA 20, EMA 50, EMA 200.
– Add RSI (14) and Volume. Optionally add MACD or Bollinger Bands.
3) Mark structure
– Identify trend direction using EMAs and swing highs/lows.
– Mark support and resistance zones from higher timeframes.
– Draw trendlines and channels if price respects them.
4) Plan risk
– Decide invalidation (where your idea is wrong).
– Place a stop-loss just beyond structure, not at round numbers.
– Size your position using a fixed risk per trade (e.g., 0.5–1%).
5) Execute with rules
– Wait for a trigger candle or signal confluence.
– Enter only when your checklist is satisfied.
– Predefine take-profits at logical levels.
Create your free account on MEXC and use referral code mexc-CRYPTONEWER to save time replicating this setup.
The MEXC interface essentials you should actually use
- Timeframe controls: Flip between HTF (4H–1D) for bias and LTF (5–15m–1H) for entries.
- Drawing tools: Horizontal Rays for SR, Trendlines for channels, Fibonacci Retracement for pullbacks.
- Indicator panel: EMA, RSI, MACD, Bollinger Bands, VWAP (intraday), Volume Profile if available.
- Order book and depth chart: Spot supply/demand, but treat them as context—not a standalone signal.
Pro tip: Save multiple layouts—“Swing,” “Day Trade,” and “Scalp”—each with different timeframes and indicators. This keeps you from cluttering one chart with everything.
Read price action first, indicators second
Indicators are derived from price. So start with structure:
- Market structure: Are we making higher highs and higher lows (uptrend) or lower highs and lower lows (downtrend)?
- Key levels: Prior swing highs/lows, daily/weekly opens, and round numbers.
- Liquidity zones: Wicks and consolidation edges where stops are likely clustered.
Then add indicators to confirm:
- EMA stack: In an uptrend, EMA 20 above EMA 50 above EMA 200 with price respecting EMA 20/50 pullbacks.
- RSI: Momentum confirmation. Favor longs when RSI recovers from 40–50 in an uptrend, shorts when it fails at 50–60 in a downtrend.
- MACD: Look for cross and histogram slope aligned with your bias.
- Bollinger Bands: Expansion suggests volatility phase; contraction suggests squeeze conditions.
Support, resistance, and trendlines on MEXC
1) Mark higher timeframe zones
– On the 1D/4H chart, draw horizontal zones where price repeatedly reacted. Include swing highs/lows and gaps.
2) Zoom in for precision
– On the 1H/15m chart, refine those zones to tighter levels for entries and stops.
3) Draw trendlines with intention
– Two or more touches make a valid line. Only use trendlines price respects; delete the rest.
4) Set alerts and be patient
– Let price come to your level. Your job is to react, not chase.
The three setups that repeatedly work on MEXC
1) Breakout and retest
– Context: Price compresses below resistance or above support.
– Trigger: Clean breakout candle with volume expansion.
– Entry: On retest of the broken level holding as new support/resistance.
– Invalidation: Back inside the range with a close.
– Targets: Prior swing extremes or measured move based on the range height.
2) Trend pullback to EMA 20/50
– Context: Strong EMA alignment, clear higher highs and higher lows (or opposite for shorts).
– Trigger: Bullish (or bearish) reversal candle at EMA with RSI holding above (or below) 50.
– Entry: After confirmation close to avoid knife-catching.
– Invalidation: Close through EMA 50 and structure break.
– Targets: Recent swing high/low and extension levels (e.g., Fibonacci 1.272/1.618 if trend is strong).
3) Range fade with RSI divergence
– Context: Flat range with defined boundaries.
– Trigger: Price tags range edge while RSI forms higher low (bullish div) or lower high (bearish div).
– Entry: On rejection wick or micro-structure break toward the range midpoint.
– Invalidation: Acceptance beyond the range with volume.
– Targets: Midpoint first, far edge second.
How to Analyze Charts on MEXC with Fibonacci the right way
- Anchor swing: For longs, drag Fibonacci from swing low to swing high; for shorts, from swing high to swing low.
- Watch 38.2% and 61.8%: Momentum trends often respect 38.2%; deeper corrective moves check 61.8%.
- Confluence is king: A 61.8% retrace aligning with EMA 50 and prior resistance turned support is A+.
- Extensions for targets: 1.272 and 1.618 are common targets after breakouts.
Volume, order book, and depth chart without the hype
- Candle volume: Strong green breakout candles with rising volume are quality. Fading volume on a rally warns of exhaustion.
- VWAP for intraday: If price holds above VWAP with higher lows, bias stays bullish until it loses VWAP with conviction.
- Order book: Large walls can be spoofed. Only trust levels confirmed by price reaction and time spent.
- Depth chart: Use to visualize imbalance, but always check if the tape and candles agree.
Risk and trade management that keeps you in the game
- Fixed fractional risk: Risk a small percentage per trade (0.25–1%).
- Logical stops: Place beyond structure, not at round numbers or obvious wicks.
- Scaling: Consider partial profits at the first target to reduce stress, then trail below swing lows or EMA 20/50.
- Avoid overtrading: Three solid trades beat ten forced ones.
- Journal: Record your setup, trigger, stop, targets, emotions, and result.
Set up your account and follow along live: MEXC sign-up link with referral code mexc-CRYPTONEWER
Timeframe alignment playbook
-
Swing traders
- Bias: 1D
- Setup: 4H
- Entry/management: 1H
- Indicators: EMA 20/50/200, RSI, MACD
-
Day traders
- Bias: 4H
- Setup: 1H
- Entry/management: 15m–5m
- Indicators: EMA 20/50, RSI, VWAP intraday
-
Scalpers
- Bias: 1H
- Setup: 15m
- Entry/management: 5m–1m
- Indicators: EMA 9/20/50, VWAP, tape and volume focus
Consistency comes from separating your bias timeframe from your execution timeframe.
Candlestick signals worth your attention
- Pin bars and hammers: Rejection of a level, strongest when at HTF support/resistance with volume.
- Engulfing candles: Momentum shift, especially after a pullback in trend.
- Inside bars: Compression; look for breaks aligned with the prevailing trend.
- Breaker blocks: Failed breakouts flipping a level into strong support/resistance.
Avoid using single candles in isolation; combine them with SR, trend, and volume.
Indicator stacks that pair well on MEXC
- Momentum stack: EMA 20/50 + RSI + MACD
- Use for trend continuation and pullbacks.
- Volatility stack: Bollinger Bands + RSI
- Use for squeezes and volatility expansions.
- Mean reversion stack: VWAP + RSI divergences
- Use intraday to fade extremes back to the mean.
When your stacks disagree with structure, trust structure first.
Futures nuance on MEXC without blowing up
- Funding rate: Extreme positive funding plus crowded longs at resistance can precede pullbacks.
- Leverage: Use minimal leverage until your edge is proven. Smaller size keeps emotions in check.
- Wick protection: Futures can wick. Place stops with a buffer beyond obvious highs/lows.
- Hedging: If you swing long on spot, a small futures short at resistance can hedge overnight risk.
If you are new, practice on spot and paper trade futures until your journal shows consistency.
A step-by-step example trade
1) Bias
– 4H shows uptrend with EMA 20 > 50 > 200, higher highs and higher lows.
2) Levels
– 1D resistance at 2.10, prior breakout level at 1.85, recent pullback low 1.92.
3) Setup
– Price consolidates under 2.10 with decreasing volatility. RSI holds above 50.
4) Trigger
– Breakout through 2.10 with a strong green candle and rising volume. Wait for a retest.
5) Entry
– Retest of 2.10 holds as support; bullish pin bar closes above 2.10.
6) Risk
– Stop at 2.03, just below retest lows and beneath the pin’s wick.
7) Targets
– First at 2.24 (prior measured move), second at 2.36 (1.272 extension), leave a runner toward 2.48.
8) Management
– Take 50% at first target, move stop to break-even, trail remainder under EMA 20 on 1H.
9) Review
– Log what worked: confluence between breakout, volume, EMA stack, and RSI.
Try replicating this flow on a liquid pair chart on MEXC. Use referral code mexc-CRYPTONEWER when you sign up.
Common mistakes to avoid
- Trading against your higher timeframe bias just because the 5m looks tempting.
- Entering before confirmation and moving stops wider once price goes against you.
- Ignoring volume and trading breakouts with thin participation.
- Over-indicator syndrome. Two or three well-chosen indicators beat a dashboard.
- Failing to journal. Memory is biased; data is objective.
Your repeatable MEXC analysis routine
-
Pre-market scan
- Filter for pairs with increasing volume and clean structure.
- Note daily levels and news catalysts.
-
Session plan
- Define bias, key levels, invalidation.
- Choose one setup to focus on that session.
-
Execution
- Wait for your trigger: candle, retest, or divergence.
- Place orders with predefined stop and target.
-
Post-trade
- Screenshot chart and write a two-line summary.
- Tag the setup and outcome for later review.
Build this habit and your edge compounds.
Tools and settings you can copy today
- EMAs: 20, 50, 200
- RSI: 14, levels 40–60 mid-zone, 30/70 extremes
- MACD: Standard 12, 26, 9
- Bollinger Bands: 20 period, 2 deviation
- VWAP: Session-based for intraday
- Alerts: Price at SR, EMA touches, RSI crossing 50
Save them into a named layout like “MEXC Core TA.”
Turn analysis into action on MEXC
- Decide your trader type (swing, day, scalp) and commit to the corresponding timeframes.
- Choose one setup and trade only that setup for two weeks.
- Use small size, strict stops, and a journal to iterate.
- Scale only after you’ve logged 20+ trades with positive expectancy.
Ready to apply this playbook live on real charts Join with the MEXC referral link and enter code mexc-CRYPTONEWER during sign-up.


